
MARKET COMMENTARY
CURRENT MARKET CONDITIONS
The real estate market has changed significantly since the early part of the year. We are decidedly in a buyer's market. The starter homes that are not over priced are still selling OK. These are mostly in the under $300k range. Move up homes are slow and luxury homes are languishing. The higher the price range, the less buyer traffic. Homeowners with sub 4% mortgages are hesitant to replace them with new 6% - 7% mortgages.
The market is starting to look like the market 20 years ago when pricing and demand for housing peaked. Although the reasons for the change are much different, it still feels like deja vue all over again. Due to the slowing market, sellers should price their homes towards the lower end of fair value and buyers should not be afraid to throw the seller an offer the seller may not like. In markets like this, negotiation skills have a high value.
What is causing the problem? 6%-7% mortgage rates have been around for a couple of years and demand was still good. The bull market in real estate has been in force for over a decade. Employment and the economy are strong. Could it simply be exhaustion? Have the buyers that wanted to buy already bought and there aren't enough new ones to buoy the market? What about the historically low rate of home ownership, doesn't that count anymore? How about tariffs and the uncertainty surrounding them?
The answer might be "all of the above". The other concepts have been in focus for quite some time, but tariffs have been flying under the radar for most of us until lately. So let's look at tariffs.
Tariff Basics
Tariffs are a tax paid by individuals or businesses that import goods. If the goods are sold or incorporated into American made products, the reseller adds the tariffs to the costs of production. The higher costs get passed on to the consumer. Manufacturers and retailers are not going to eat a significant portion of the added costs unless they have excessive profit margins. No matter what side of the political spectrum a consumer is on, they are going to pay more.
The actual purpose of the tariffs is to provide revenue to replace the revenue lost by extending the 2017 income tax cuts that are coming to an end. What we may save on income taxes by the extension, we will lose on tariffs in the form of higher prices. Lower income consumers will suffer the most as a higher percentage of their paychecks go to purchasing goods than high income consumers and the goods they buy tend to be produced overseas.
Just buying American won't solve the problem. Much of what is built in America is built with components from other countries. It will take years for new industries to develop and start manufacturing components in the US if the goal is to produce everything domestically. It takes a significant monetary investment to do so. In less than 4 years the tariffs will most likely go away as administrations change and business can go back to finding the most cost effective way to provide products for consumers.
The American economy is mostly service related, about 77% of GDP. Manufacturing accounts for about 10% of GDP. Even if manufacturing doubled, it would still be a small part of GDP. To dramatically increase American manufacturing it would have to get over the manpower hurdle. Our economy is now at full employment with a jobless rate of about 4%. Economists consider a jobless rate of 5% as being fully employed. Take away the foreign workers, documented and undocumented, that are being pushed out of the country and there won't be enough workers to satisfy the current levels of production whether they are in goods or services. How can we increase domestic manufacturing, farming, or construction without the manpower needed?
We are part of a global marketplace and will remain so with or without tariffs. The big difference is we all are getting a massive tax increase and our trading partners are getting one too. Our tariffs will be met by reciprocal tariffs. However, our trading partners have a choice of buying American or buying from somewhere else that won't have a tariff placed on their goods. We don't have that option, virtually all of our global trading partners will be hit with tariffs and they will hit back.
Over a century ago most of the revenue the US received was tariff related. As tariffs declined, and other taxes took their place our economy grew. Its growth catapulted us into the global powerhouse we are today. Historically, high tariffs reduce consumption which reduces GDP. As a result of the tariffs Americans will reduce purchasing, our businesses will see smaller profits or greater losses. Our products are already being boycotted by consumers around the globe that don't appreciate being bullied, which will further reduce our GDP. The rising prices will generate inflation and possibly put us into a recession or worse yet, stagflation. It will be difficult for the Federal Reserve to lower interest rates in a rising inflation or stagflation environment.
Tariffs do have a use. Done strategically, they can be used to level the playing field, protect a disadvantaged domestic industry, provide leverage to get offenders to play nice, and diversify the tax base. When done to an excess or abusively, it can damage the economy and a country's world standing.
How does all this affect the housing market?
New construction prices will be dramatically higher as many of the components needed come from outside of our borders. To avoid paying the tariffs, more consumers will look towards existing housing. The increased demand will push prices up there too. Bad for buyers, but good for sellers unless the sellers need to buy another house. This assumes that the consumer won't be too badly damaged (loss of employment, higher debt, less savings) and will be able to get financing.
If the tariffs remain in place for long, there will be fewer buyers and probably fewer sellers. When the economy slows, consumer confidence falls as consumers hunker down to weather the "storm". Buyers will still buy, but they will have to settle for smaller homes. Landlords should do well as would be buyers opt for renting. If all plays out as anticipated I would expect to see a serious contraction in the housing market at least until the next administration removes the tariffs.
PRE- APRIL MARKET
CONDITION
Interest Rates & Housing Prices
To get an idea on how mortgage rates affect housing prices, look at the table below which illustrates the impact of rising or falling mortgage rates. Let's assume the current interest rate is 3.5% (wishful thinking). The table assumes a $200,000 purchase price, 30 year 95% conventional loan, $350 in taxes, $150 in insurance & $100 in MIP per month.| Rate | Payment |
| 2.5% | $1,351 |
| 3.0% | $1,401 |
| 3.5% | $1,453 |
| 4.0% | $1,506 |
| 4.5% | $1,563 |
| 5.0% | $1,620 |
| 5.5% | $1,679 |
| 6.0% | $1,739 |
| 6.5% | $1,801 |
| 7.0% | $1,864 |
| 7.5% | $1,928 |
Most buyers don't look as much at the purchase price as they do the payment. The payment is what affects their current monthly finances, purchase price affects their capital gains some time in the future. Mortgage qualification is limited by payment as lenders want to make sure the loan can be easily repaid. The table below keeps the monthly payment static at around $1,450 and adjusts the purchase price. Taxes, insurance and MIP are also adjusted as the value of the property changes.
| Rate | Price |
| 2.5% | $214,000 |
| 3.0% | $207,000 |
| 3.5% | $200,000 |
| 4.0% | $193,000 |
| 4.5% | $186,000 |
| 5.0% | $179,000 |
| 5.5% | $173,000 |
| 6.0% | $167,000 |
| 6.5% | $160,000 |
| 7.0% | $155,000 |
| 7.5% | $150,000 |
As you can see, interest rates have a significant effect on pricing. Rates for 30 year conventional loans bounced around between roughly 3.5% and 4.5% for most of the period from mid 2011 to early 2020 then broke through the 3.5% resistance level later in 2020, bottoming out at about 2.5% just after the new year in 2021. Rates remained under 3.5% for a year and then started their rapid ascent. You can see a graph by going to the home page of our site and clicking on the "Historical Mortgage Rates" link towards the bottom of the page.
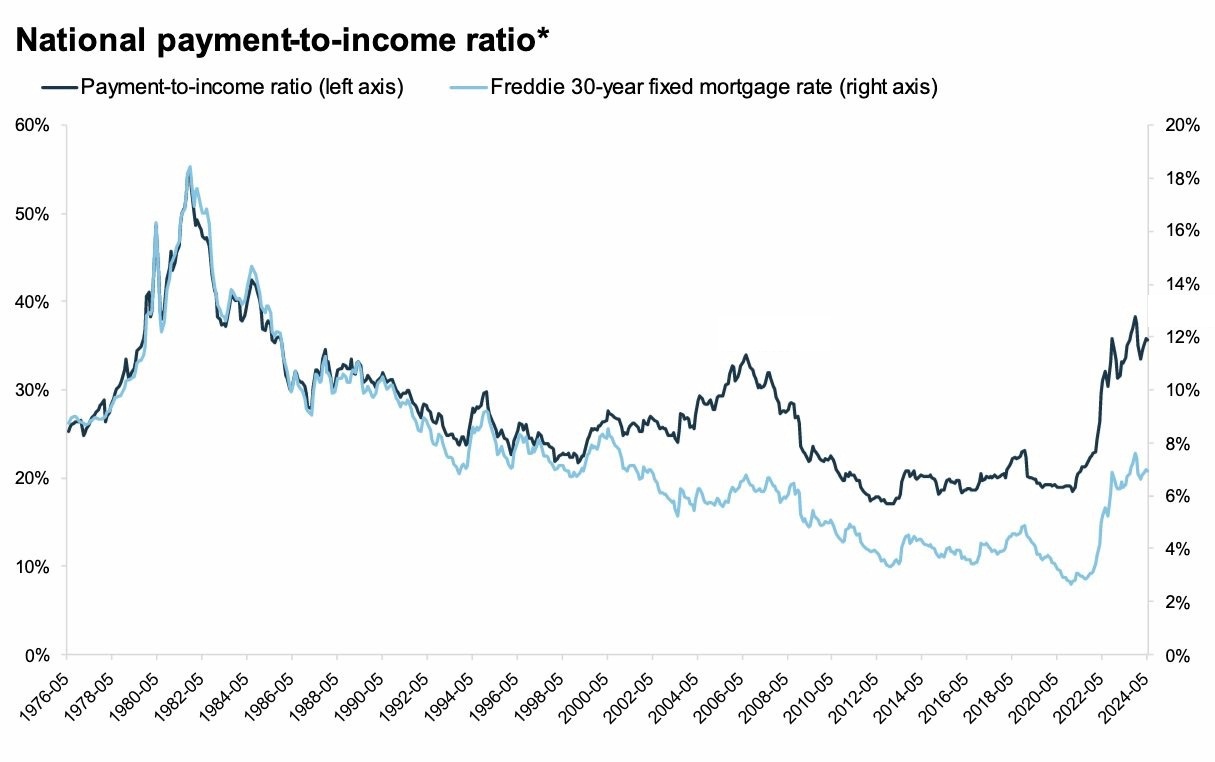
The chart below gives you an idea on how expensive houses are currently relative to other recent periods.
Measuring the Past
The charts below will give us some insight into the last 5 years of market activity. They may help us chart a path for this year so we can navigate the year more profitably.
An important factor for the local real estate market
is the local economy. Omaha's economy was not badly damaged by the
pandemic or rising rates and is currently doing well. Our unemployment rate
is at historic lows and is one of the lowest in the country. To keep a
balanced market you want to see supply and demand move in the same
direction. Supply seems to be increasing and approaching normal levels of inventory. That
is part of the reason for the downward pressure on pricing. One of the reasons for
what has been lackluster supply
has been the move-up market being slowed by the rise in interest rates. People
that currently own a home are reluctant to give up a 3% to 4 % mortgage rate
to buy another house with a 6% to 7% rate. Sellers may not necessarily be
selling with the objective of buying another house, so not every seller will
become a buyer. There should be pent up demand waiting for rates
and or prices to drop, but the high tariffs we are paying threaten to change
that dynamic.
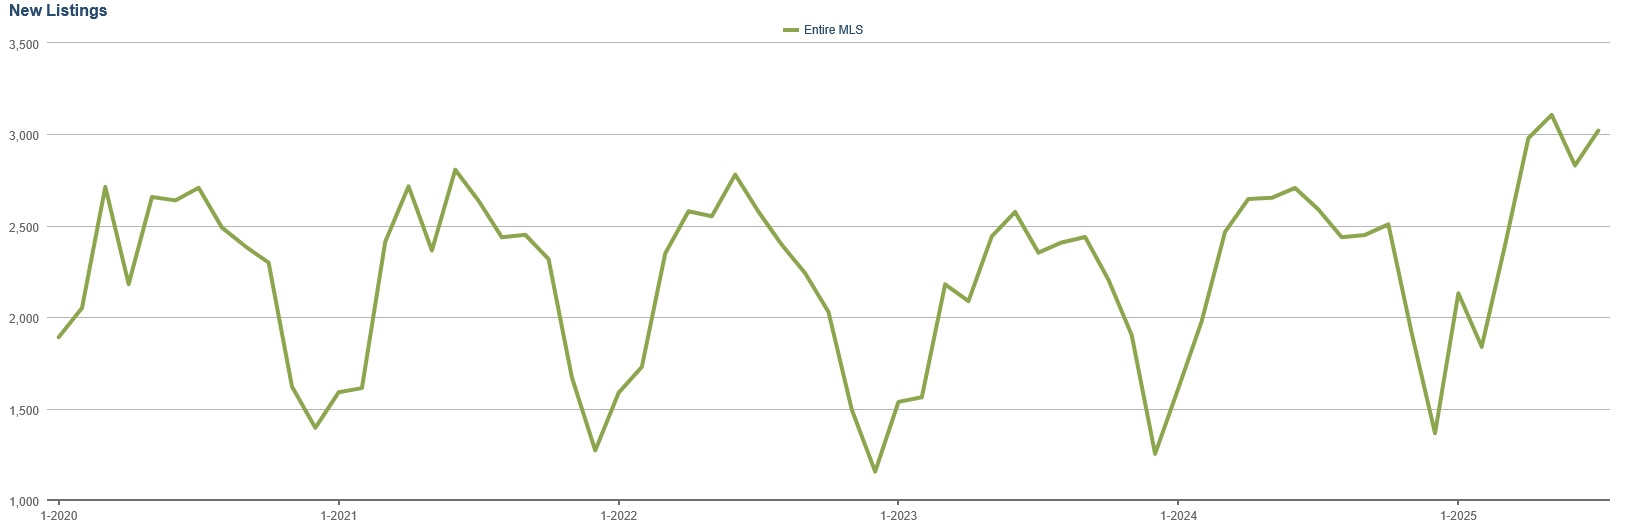
New listings have been in a seasonal trading range over the last 5 year period. We broke out of that trading range this year on the upside. Without a corresponding break out in closed sales, inventory rises and prices are under pressure. In a healthy market as the number of new households grow and more houses are built and more houses should come on the market as well as more houses should be sold. The low number of listings had been a major factor contributing to the auction like bidding process buyers had to go through in past years. Now there are more negotiated sales prices and much less bidding. In higher priced houses, there are much longer market times and price reductions are common. They are a small minority of the overall market, but the change in sentiment is notable. In fact it has been filtering down to mid and low range houses.
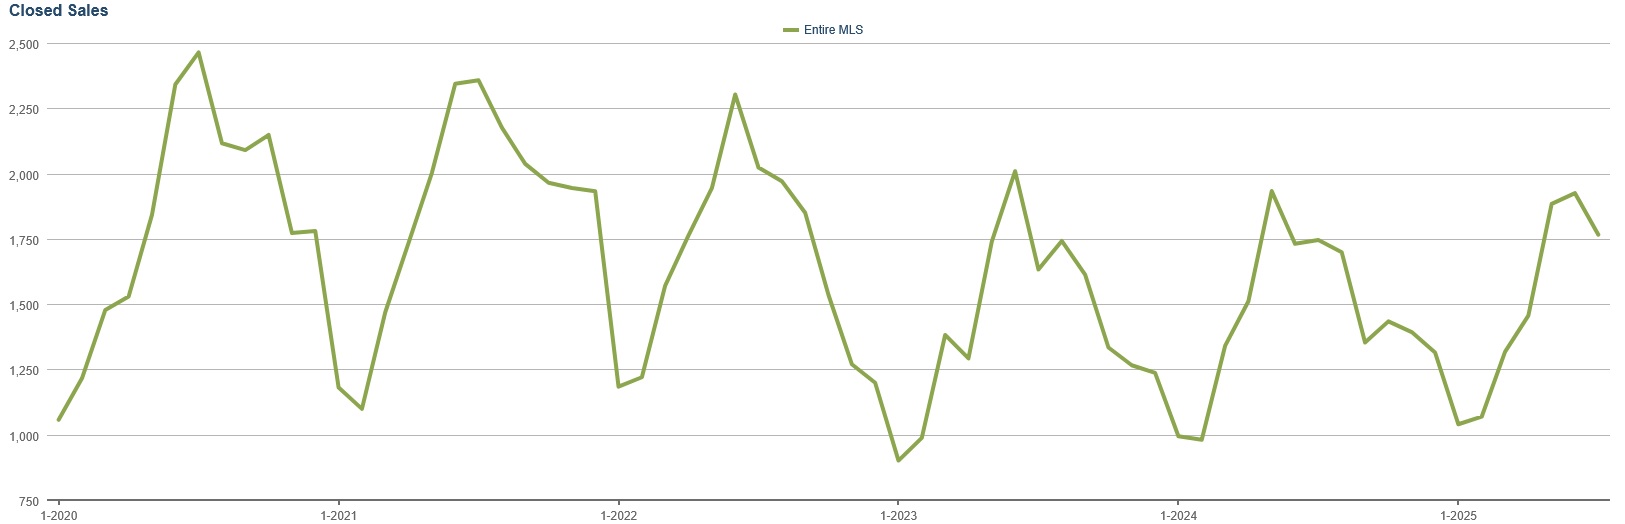
There has been a noticeable reduction in the seasonal range for closed sales over the last 2 years. Compared to the consistent range for new listings, until this year's break out, the trend change for closed listings indicate an increase in unsold listings as interest rates rose and buyer activity slackened. The slackening of buyer activity is likely to increase due to the increase in listings this summer. This points to a slowing housing market.
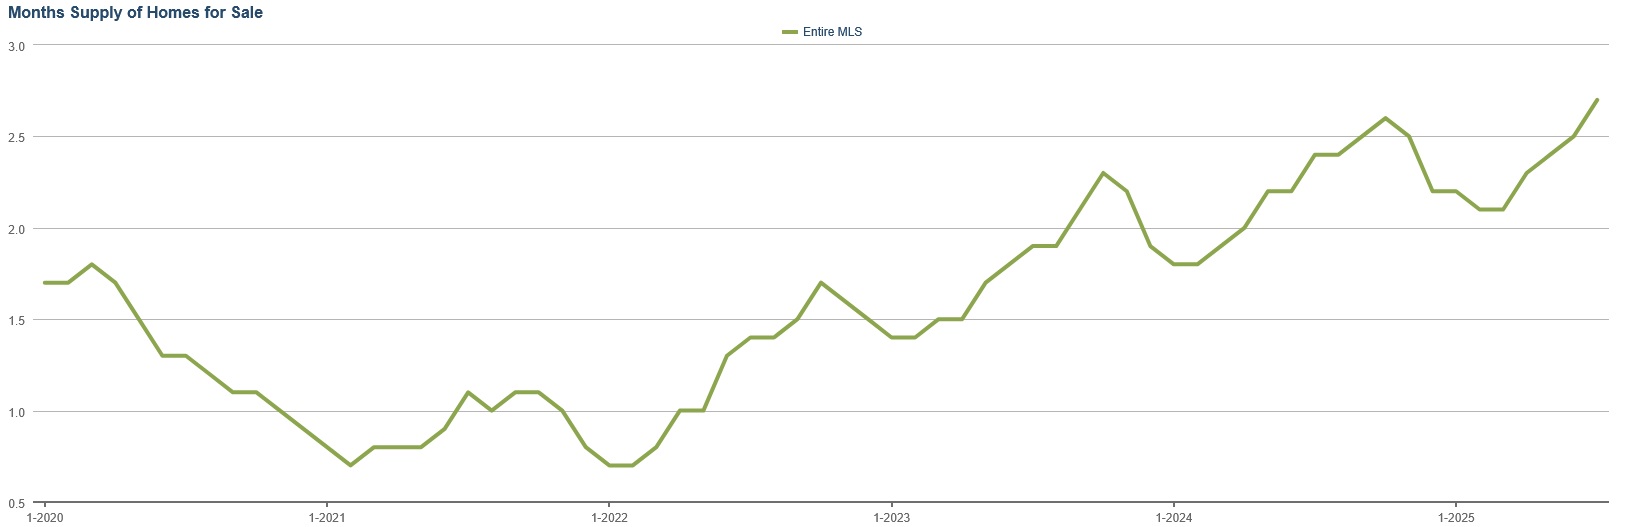
Months Supply of Homes for sale, which shows the supply of active listings relative to sales, had made a significant break out. It normally vacillates between 1 1/2 and 2 1/2 months, but in 2020 it fell to under one month and stayed under the normal range for nearly 3 years. The available supply has jumped strongly from the abnormally low levels and moved into the normal range. It is now testing the high end of normal, threatening to rise further into excessive supply. The chart pattern shows that the serious supply shortage has disappeared.
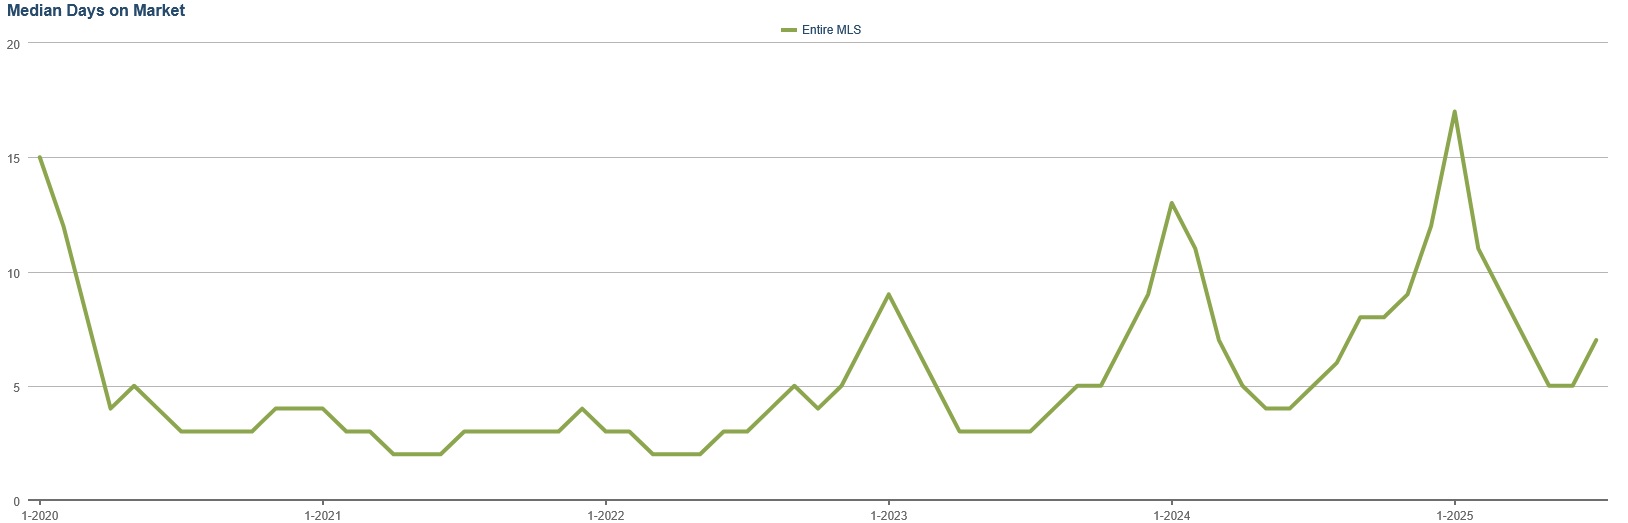
A truly telling indicator is shown in the Days on the Market chart, which shows the dire shortage of inventory in the first half of the chart. For virtually the entire year of 2020, 2021 and 2022 houses sold in less than 5 days. This is almost unprecedented. It confirms what we saw in other charts, that the market is slowing down and approaching normality. The numbers mask what is going on in the upper and mid range houses. Entry level houses still sell very quickly and they comprise the largest part of the inventory. First time home buyers are buying because they need a house. Higher rates just force them into smaller houses. The chart shows a volatile, but rising trend.
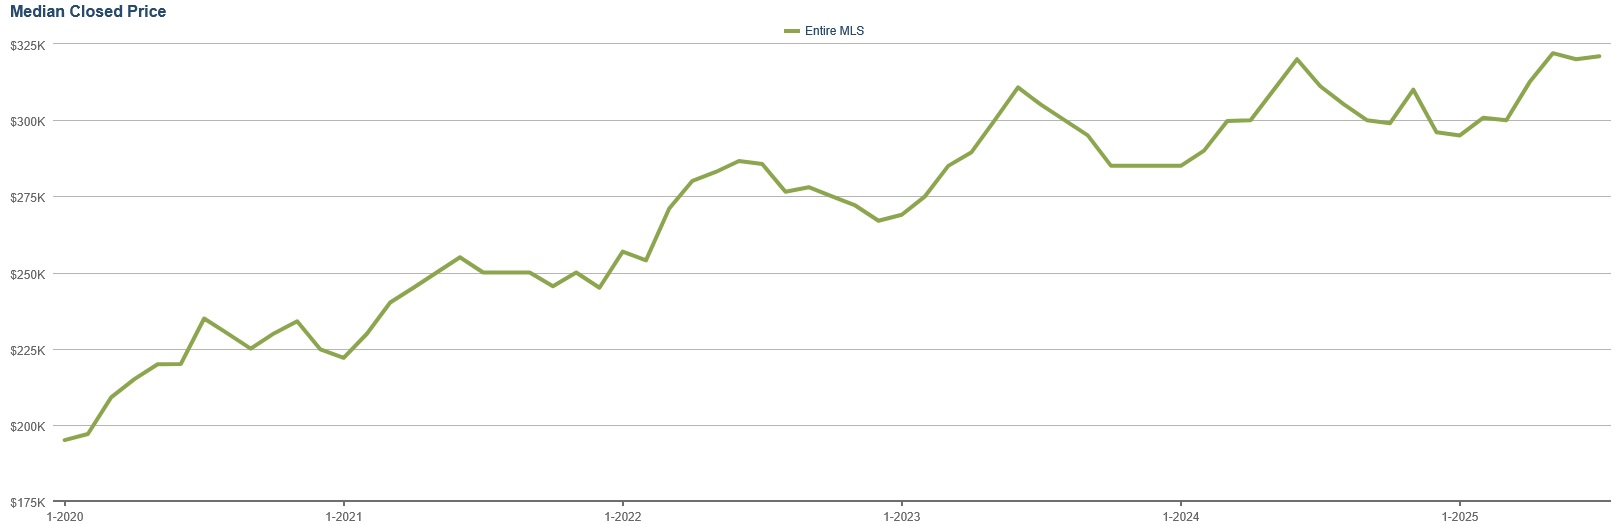
The final chart shows the median price of listings
that have sold. Prices had risen at a much greater rate than normal due to
the need for buyers to bid over list to be able to get a house. The normal end of year price decline,
a sign of a normal market, which stopped occurring during the heady markets
at the beginning of the decade occurred in 2022, 2023 and 2024. End of the
year prices plateaued instead of declining in both 2020 and 2021. Activity
normally relaxes as the year winds down due to slowing buyer activity around
the holidays and winter season. The rapid
price rise in
the first half of 2020, 2021 and 2022 showed the continued out of balance conditions in the
market. However, you can see that in July and August of 2022 the trend started reversing
as rates hit levels that took many buyers out of the market. Prices
rebounded and made solid gains in the first half of 2023 as rates
relaxed a bit, but that trend reversed in the last half of the year. Some
of that reversal could have been normal seasonal pricing pressure, but I suspect
there was more to it. 2024 saw prices stabilize a little above the levels of
the prior year and 2025 started the year out weakly but bounced back to a
more normal trend.
Where
does it go from here? The wild card is the tariffs and how badly they damage
the economy and employment. Mortgage rates may decline if the bond market
pushes long term rates lower due to the increased fear of a recession. They
could also rise if the Federal Reserve sees a risk of inflation coming back
and starts raising short term rates again. How the economy navigates the
impact of the tariffs will be the determinate of the direction of mortgage
rates and the housing market. The Federal Reserve and the last
administration did a good job of steering the economy through what could
have been a real rough patch post covid. Can the current administration and
Federal reserve do it again post tariffs?
August 22, 2025
The
real estate
experts in Omaha and Lincoln Nebraska
Serving Bellevue, Bennington, Elkhorn,
Gretna, La Vista, Lincoln, Omaha, Papillion, Ralston and surrounding
communities.